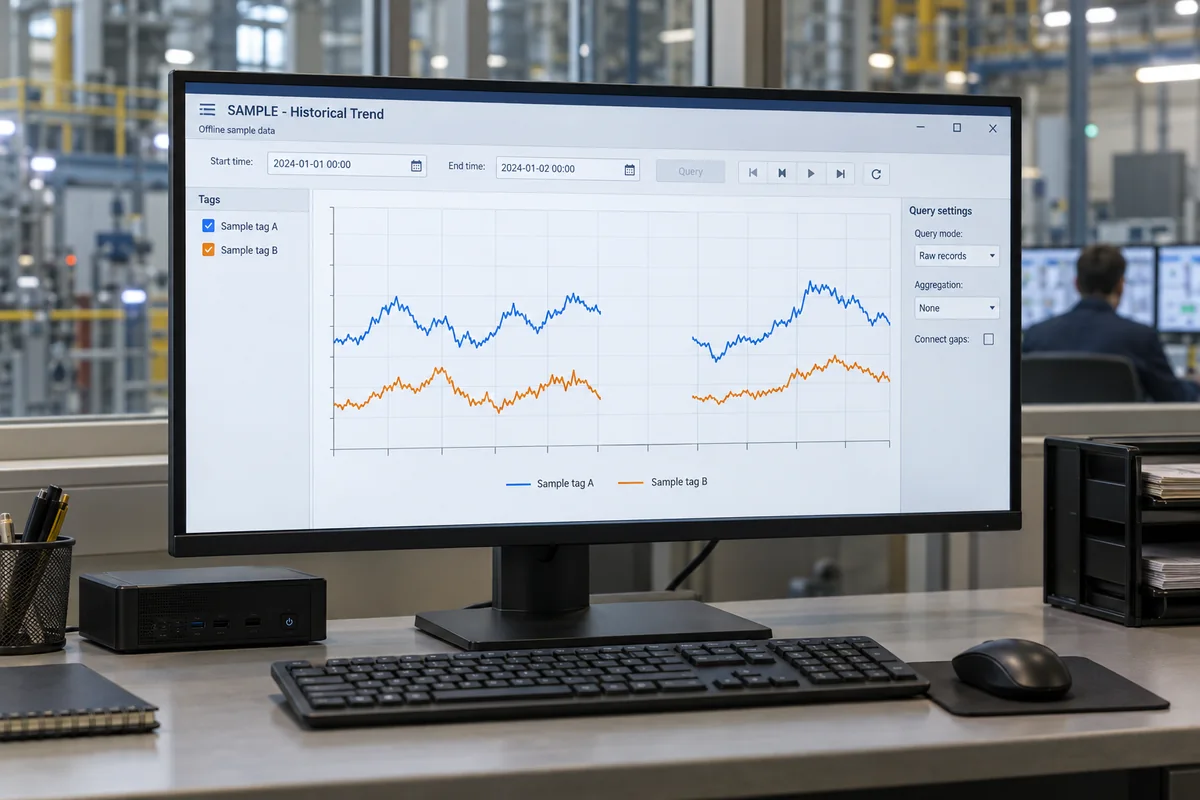
Machine-history visualization software for tag trends and data gaps
Time-series display layer for recorded machine signals
Machine-history visualization software turns timestamped machine signals into trend plots for operators and engineers. It lets the user select signals and a time window, inspect changes and compare events. Its query and display settings determine which records appear and how gaps and intermediate values are shown.
Time-series visualization software for machine monitoring, focused on historical tag queries, trend pens, aggregation and data-gap display. Condition monitoring systems supply the broader sensing and diagnostic chain; wired vibration monitoring (9720), scheduled wireless waveform monitoring (9731) and resonance inspection stations (2780) are separate equipment. This page covers the software display/query layer rather than sensors, acquisition electronics or a machinery protection trip system.
CNFX editorial research · Sources checked October 19, 2026 · 3 sources
Choose the time window and returned records before styling the trend
Ignition Perspective’s Power Chart displays configured pens and lets users add historical tags. Its realtime mode follows a recent window; historical mode uses chosen start and end times. The reviewed documentation also states that the component requires a Historian license. Include the history provider and licensing scope in the software offer. [1]
The Tag History binding documents different retrieval modes: PointCount requests a selected number of records, Periodic requests time-spaced results, and AsStored returns database records. Aggregation is another choice: Average is time-weighted, while SimpleAverage averages the recorded values without that time weighting. Name the query mode and aggregate in the trend specification. [2]
The same binding documentation warns that a historical query includes its end date. Adjacent time-window results may therefore overlap at the boundary. When comparing a chart and an export, keep the start/end convention and aggregation identical. [2]
02
Decide how missing values and repeated timestamps reach the plot
Grafana’s time-series documentation expects unique timestamps within a series and warns that repeated timestamps may render unexpectedly. Ignition’s AsStored binding can return separate rows for different values with the same timestamp. An integration between those data shapes needs an explicit handling rule that preserves the underlying records. [3][2]
Grafana offers line interpolation and null-connection settings. Ignition separately offers Ignore Bad Quality and Prevent Interpolation options on the history binding. A joined or interpolated line is therefore a display/query decision, rather than a new machine measurement. Test the chosen settings with a known gap and bad-quality record. [3][2]
Power Chart’s X Trace shows interpolated pen values, while its range brush displays aggregate summaries for the selection. It also exports the points visible on its plots to CSV. Include the active query, time range and interpolation settings when those outputs are used for review. [1]
03
Describe the machine signals and the required trend behaviour
Paste it into your enquiry below or into an email to a maker, then replace every bracket.
Explore company information and manufacturing capabilities, then discuss the scope of your project with a relevant supplier.
Share this page
Compiled and source-reviewed by the CNFX editorial team.
Verify tag mapping, time-range queries, data-gap presentation and deployment behavior using representative machine-history records. How we source and review
· Page last updated 18 October 2026
Buyer questions
Does a smooth trend line show that machine data was continuously recorded?
The chart may interpolate between points or connect null gaps. Review the query and plot settings against the underlying records. [3][2]
Can a trace tooltip be treated as a stored sensor sample?
Power Chart documents interpolated values in X Trace. Check whether the value comes from a stored record or from the display’s interpolation. [1]
Sources and evidence scope
Sources checked 2026-10-19. The reviewed Ignition documentation describes Perspective chart and history-binding behaviour. Grafana’s time-series documentation describes the plotting data shape and display options. These are named software behaviours, not universal refresh-rate or concurrency guarantees.