Optical PM sensors · reading the precision specification, EPA PM2.5 sensor targets (R², RMSE, bias), humidity and temperature effects, fan cleaning
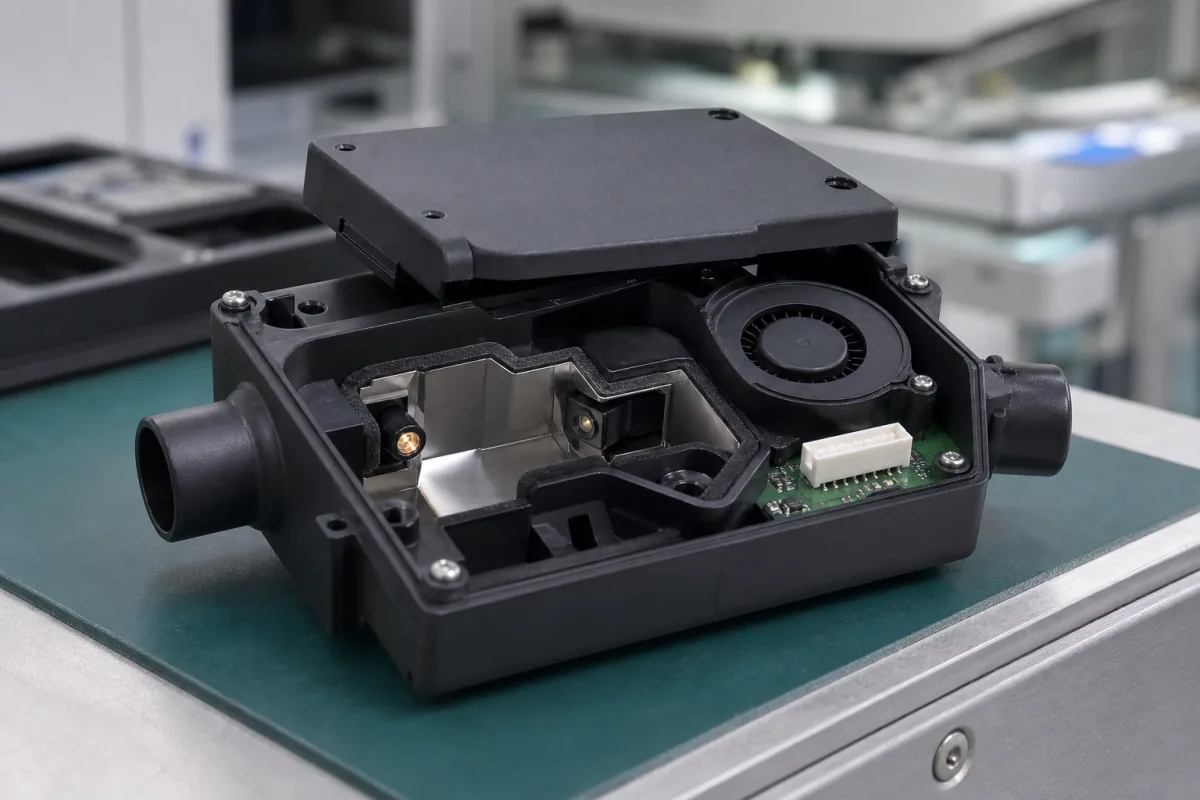
A particulate matter sensor is a small optical module in which a fan draws air through a chamber where a laser beam is scattered by particles; a photodetector counts and sizes the pulses and firmware converts them into mass concentrations such as PM1, PM2.5 and PM10, for air-quality monitors, purifiers and ventilation control. Ask three things first: what precision and calibration reference the maker states, how it has been tested against reference instruments, and how humidity, temperature and dust build-up affect its readings over time.
Optical (laser-scattering) particulate matter sensor modules and the monitors built around them for indoor and outdoor air-quality monitoring. Regulatory reference monitors (FRM/FEM), gravimetric samplers, cleanroom particle counters and stack dust monitors are outside this page.
CNFX editorial research · Sources checked October 12, 2026 · 4 sources
Read the precision specification and calibration basis
Sensirion's SPS30 datasheet (2023) gives a mass concentration range of 0 to 1,000 μg/m³ with size channels from 0.3 μm (PM1.0, PM2.5, PM4, PM10). It states PM1 and PM2.5 precision as ±(5 μg/m³ + 5% of measured value) from 0 to 100 μg/m³ and ±10% of measured value from 100 to 1,000 μg/m³, and PM4/PM10 precision as ±25 μg/m³ or ±25%, with PM4 and PM10 calculated from the distribution of measured particles. It defines precision as between-parts (device-to-device) variation and calibrates PM2.5 mass to a TSI DustTrak DRX 8533 in ambient mode. [2]
The same datasheet gives a long-term precision drift of up to 1.25 μg/m³ per year below 100 μg/m³, an additional temperature-dependent drift of 0.5% of measured value per °C (typ.) away from 25 °C, best performance between 10 and 40 °C and 20 to 80% RH, a 1-second sampling interval, a supply of 4.5–5.5 V with 45–65 mA in measurement mode, a lifetime of more than ten years at 24 h/day (MTTF-based) and automatic fan cleaning every 168 hours by default. [2]
Editorial calculation: at a PM2.5 reading of 20 μg/m³, ±(5 + 0.05 × 20) = ±6 μg/m³ between units; at 200 μg/m³, ±10% is ±20 μg/m³. Measurement-mode power is about 5 V × 55 mA ≈ 0.28 W. Two sensors of the same model can therefore differ noticeably at low concentrations, so co-locate them before comparing sites.
Give the supplier the application (indoor monitor, purifier control, outdoor station), PM channels needed, concentration range, required accuracy and reference instrument, operating temperature and humidity, enclosure airflow, output interface (UART, I²C, RS485, analogue), power budget and duty cycle, maintenance access and expected service life.
02
Ask for test results against reference monitors
US EPA's Performance Testing Protocols, Metrics, and Target Values for Fine Particulate Matter Air Sensors (EPA/600/R-20/280, 2021) covers ambient, outdoor, fixed-site, non-regulatory supplemental and informational monitoring. Its base testing places at least three replicate sensors beside federal reference or equivalent (FRM/FEM) monitors for at least 30 days at each of two sites in different climate regions, with at least one day averaging 25 μg/m³ or more. [1]
For base testing it recommends targets of precision SD ≤ 5 μg/m³ or CV ≤ 30%, slope 1.0 ± 0.35, intercept between −5 and +5 μg/m³, R² ≥ 0.70, and RMSE ≤ 7 μg/m³ or NRMSE ≤ 30%. Enhanced laboratory testing examines relative humidity (40% versus 85% ± 5%), temperature (20 °C versus 40 °C), drift at low (10 μg/m³) and mid (35 μg/m³) concentrations, and accuracy at high concentrations, without target values. [1]
Editorial note: a datasheet's precision describes unit-to-unit spread against the maker's calibration aerosol, while the EPA metrics describe agreement with reference monitors outdoors; ask suppliers for field results in EPA format, not only the datasheet.
Field data show why correction matters. Barkjohn, Gantt and Clements of US EPA (Atmospheric Measurement Techniques 14:4617, 2021) compared almost 12,000 24-hour PM2.5 averages from PurpleAir laser sensors with collocated FRM or FEM monitors in 16 states and found the raw sensor data overestimated PM2.5 by about 40%, a bias seen across US regions. Their nationwide correction, PM2.5 = 0.524 × PA(cf_1) − 0.0862 × RH + 5.75 with RH in percent, cut RMSE from 8 to 3 µg/m³ against an average reference concentration of 9 µg/m³, and is applied on the AirNow Fire and Smoke Map. [3]
Editorial calculation: with that equation, a raw cf_1 reading of 30 µg/m³ at 50% RH becomes about 0.524 × 30 − 0.0862 × 50 + 5.75 ≈ 17.2 µg/m³, so the published correction is specific to that sensor type; ask a module supplier for its own field comparison data. [3]
03
PM1/PM2.5/PM10 modules sold with IoT, gas-sensing and air-quality instrument ranges
Listings include PM1/PM2.5/PM10 sensors among weather-station and environmental IoT sensors, particulate matter sensors with gas and air-quality modules, and PM2.5 detectors and dust particle counters among air-quality instruments. Ask each for the sensing module used, calibration reference and test data.
04
Compare field R² by size fraction before trusting PM10 outputs
South Coast AQMD's AQ-SPEC programme compares sensors in the field with federal reference or equivalent method instruments at an air monitoring station, and tests them in an environmental chamber at controlled temperature, humidity and pollutant levels. Its summary table lists, for the Sensirion SPS30, a field R² of 0.91 for PM1.0, 0.80 to 0.83 for PM2.5 and 0.07 to 0.20 for PM10, with field mean absolute errors of 1.3 to 1.4, 2.0 to 5.1 and 10.8 to 24.7 µg/m³, and a lab R² of 0.99 for PM1.0 and PM2.5. [4]
The PurpleAir PA-II is listed with field R² of 0.93 to 0.97 for PM2.5 and 0.66 to 0.70 for PM10. AQ-SPEC notes that each field result comes from a specific 30- to 60-day period at one station and may not be replicable at another location, season or time. [4]
Editorial note: the SPS30 PM2.5 field range of 0.80 to 0.83 is above the EPA base-testing target of R² ≥ 0.70 for PM2.5 sensors [1], while its PM10 range is far below that level; the SPS30 datasheet states that PM4 and PM10 are calculated from the measured size distribution [2]. Ask suppliers for PM10 field data before using PM10 outputs.
SPS30 output
Field R²
Field MAE (µg/m³)
PM1.0
0.91
1.3 to 1.4
PM2.5
0.80 to 0.83
2.0 to 5.1
PM10
0.07 to 0.20
10.8 to 24.7
05
Laser diode, photodetector, optical chamber, fan, firmware and interface
Firmware and calibration decide how counts become mass: the SPS30 is calibrated to a TSI DustTrak DRX 8533 and derives PM4 and PM10 from the measured size distribution, the output where AQ-SPEC's field R² falls to 0.07–0.20. [2][4]
Mass range, precision and field accuracy, humidity effect, supply and interface for a PM sensor order
The accuracy row mixes three kinds of figure, a datasheet's unit-to-unit precision, EPA's field target and one study's raw bias, so ask which one a supplier's number is; ingress protection and dimensions have no published value here. [2][1][3]
Field
What it means and published values
Ask the supplier for
Measurement Range (μm)
Example size channels from 0.3 μm to 2.5 or 10 μm. [2]
3 companies list this product among what they make. Company figures are quoted from each
company's own website; every card states where the relationship came from.
Changsha Zoko Link Technology Co., Ltd.
Manufacturing site to be confirmed for the order
Lists PM1, PM2.5 and PM10 particulate matter sensors among weather-station and environmental IoT sensors (NiuBoL).
Explore company information and manufacturing capabilities, then discuss the scope of your project with a relevant supplier.
Share this page
Compiled and source-reviewed by the CNFX editorial team.
Each manufacturer above links to the page on that company's own website where the product is listed, with the date we checked it. How we source and review
· Page last updated 13 October 2026
Buyer questions
What does a PM sensor's ± precision mean?
Sensirion defines it as between-parts variation; for SPS30 PM2.5 it is ±(5 μg/m³ + 5%) below 100 μg/m³. [2]
What performance does EPA expect of PM2.5 sensors?
Its base-testing targets include R² ≥ 0.70, slope 1.0 ± 0.35, intercept within ±5 μg/m³ and RMSE ≤ 7 μg/m³. [1]
How long should a test last?
EPA recommends at least three sensors beside reference monitors for at least 30 days at each of two sites. [1]
Do low-cost PM2.5 sensors read high?
A US EPA study of almost 12,000 daily PurpleAir–reference pairs found raw data about 40% high; an RH-based correction cut RMSE from 8 to 3 µg/m³. [3]
How well does a low-cost PM sensor track reference monitors outdoors?
South Coast AQMD's AQ-SPEC table lists field R² of 0.80 to 0.83 for the Sensirion SPS30 on PM2.5 but 0.07 to 0.20 on PM10. [4]
Sources and what still needs a direct check
Sources checked 2026-10-12. EPA's report is US government guidance for non-regulatory sensor testing. Sensirion's datasheet describes its own sensor; its values are examples, not general limits. Barkjohn, Gantt and Clements (2021) is a peer-reviewed US EPA field study of one sensor type, and AQ-SPEC is South Coast AQMD's summary of its own sensor evaluations.