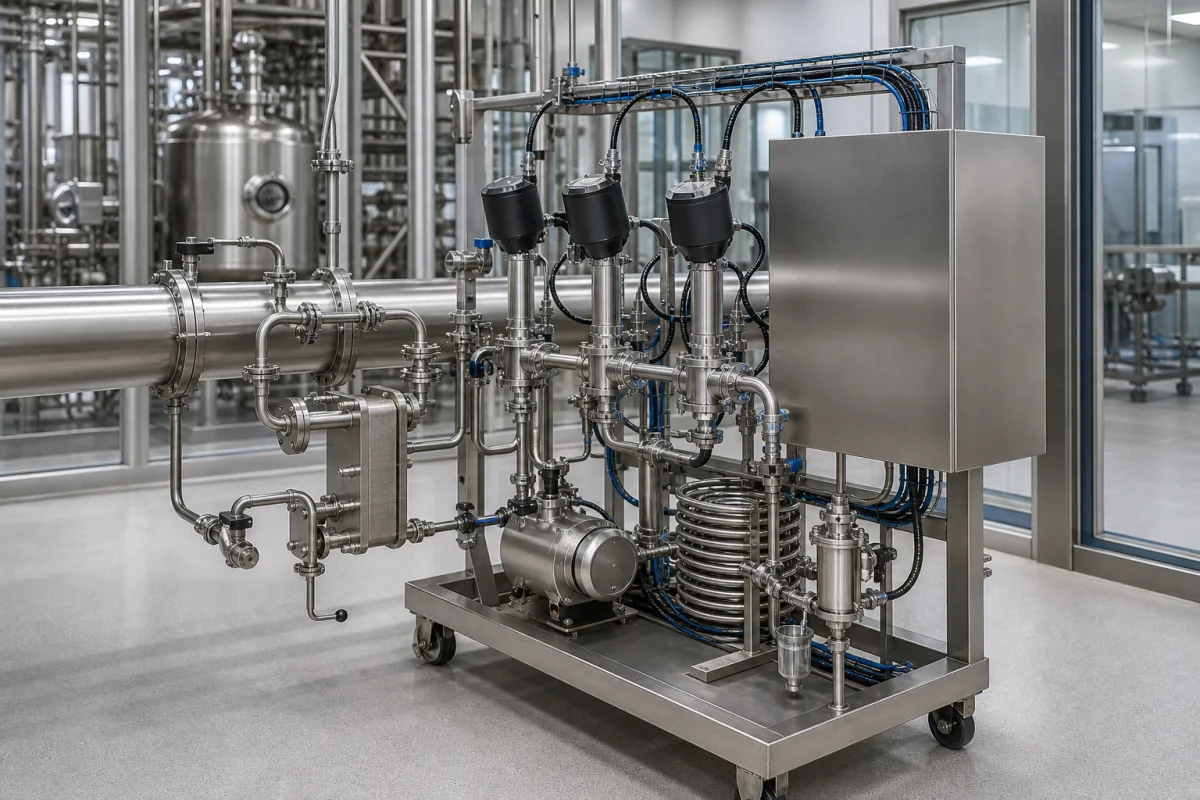
PAT sampling and flow-cell module for continuous processes: tap, transport line and conditioning sized against a one-minute response, and the in-line, on-line or at-line choice it serves
A wheeled or skid-mounted module that takes a side stream from a continuous process, conditions it and passes it through flow cells or probes, so an analyzer reads the process within a known delay
Process analytical technology puts measurement into the process stream instead of the laboratory. On a continuous line that means a module of hardware between the process pipe and the analyzer: a tap or probe in the process line, a transport line or fast loop, conditioning such as cooling, pressure reduction and filtration, and one or more flow cells or probe holders where spectrometers or sensors take their reading, with a return or drain. Every element adds delay, and an analyzer that reports a value a few minutes after the material has passed is of limited use for control. This page treats the module by that delay, by the measurement mode it provides, and by what a flow cell placed after a reactor shows in practice.
Sampling and flow-cell modules that connect continuous chemical or pharmaceutical processes to process analyzers: taps and probes, transport lines and fast loops, sample conditioning, flow cells and probe holders, and the time delay and measurement mode (in-line, on-line, at-line) they give. Optical spectrometers themselves, including FT-IR and Raman instruments, are covered on the Optical spectrometer page.
CNFX editorial research · Sources checked October 13, 2026 · 3 sources
Tap to analyzer in under a minute: time delay = line length ÷ velocity, and why gas at process pressure is the slow case
Swagelok's paper by Doug Nordstrom and Tony Waters on time delay in analytical instrumentation systems names a one-minute response as the industry standard for a sample system, and states that the analyzer's own cycle time, five minutes for a gas chromatograph in its example, adds to the delay of the tap, probe, transport line, conditioning and stream switching. It gives fluid velocity = volume flow rate ÷ line volume per unit length, and time delay = line length ÷ fluid velocity, and recommends a fast loop when the tap is far from the analyzer. [1]
The paper adds that the probe should reach the middle third of the process line, where the stream moves fastest and gives the cleanest sample that represents the process, but be no longer than necessary, because delay is directly proportional to internal volume. [1] Its Table 1 lists ½ in tubing at 30 cm³/ft while worked example 1 uses 25 cm³/ft; at 30 cm³/ft the same line would take 36 s instead of 30 s (editorial calculation), so the internal volume of the actual tubing should be confirmed.
Editorial calculation with Swagelok's equations for a compact module: 3 m of ¼ in tubing at the table's 17 cm³/m holds 51 cm³; at 0.5 L/min of liquid that is about 6 s of transport delay inside the module, before any analyzer cycle time. [1] The length and flow are assumptions for illustration.
Swagelok worked example
Inputs
Delay
1. Liquid in transport line
5 L/min through 100 ft of ½ in tubing at 25 cm³/ft → 200 ft/min [1]
State the distance from tap to module, the sample phase and process pressure, the flow available for a fast loop, and the analyzer's own cycle time, and ask for the calculated total delay.
02
In-line, on-line or at-line: which kind of measurement the module provides, and what FDA asks of the analyzer interface
FDA's guidance PAT — A Framework for Innovative Pharmaceutical Development, Manufacturing, and Quality Assurance (2004) defines three ways a process analyzer can take its measurement. [2]
The guidance states that design and construction of the process equipment, the analyzer and their interfaces are critical to ensure the collected data are relevant and representative of process and product attributes, and that installing process analyzers on existing production equipment should follow a risk analysis showing the installation does not adversely affect process or product quality. It also notes that measurements need not be absolute values of the attribute of interest; relative differences can serve process control. [2]
Editorial note: the module in the photograph, a side stream drawn from the process pipe through conditioning to flow cells, is an on-line arrangement in FDA's terms; the transport delay from the previous section applies to it, while an in-line probe in the process pipe avoids that delay but has to survive process conditions.
FDA term
Definition in the guidance
What the module does
At-line
Sample removed, isolated from, and analyzed in close proximity to the process stream [2]
Provides a sampling point and an analyzer beside the line
On-line
Sample diverted from the manufacturing process, and may be returned to the process stream [2]
Side stream through conditioning and flow cells, returned or drained
In-line
Sample not removed from the process stream; can be invasive or noninvasive [2]
Probe holder or flow cell in the process line itself
State which mode is wanted for each measurement, whether the side stream is returned or sent to drain, and the risk assessment of adding taps to the existing process line.
03
A flow cell after the reactor: FlowIR spectra every 15 and 30 seconds behind a 100–250 psi back-pressure regulator
A Mettler Toledo and Vapourtec white paper (Goode, Mansfield and Butters) shows the arrangement on a laboratory flow reactor: a 5 mL PFA tubing reactor with a 100 psi back-pressure regulator, and the FlowIR flow cell placed in-line directly after the regulator, ahead of the collection valve. [3]
The authors report that optimum conditions only occur at steady state, and that the IR trends showed higher benzaldehyde concentration at the start and end of each segment from dispersion of the reagent plug; for short plugs and long residence times this means being specific about where fractions are collected for offline analysis. [3]
Editorial calculation: a 10-minute residence segment logged every 15 s gives 40 spectra; at 30 s intervals a 15-minute segment gives 30. [3] Placing the flow cell after the back-pressure regulator, as here, means it sees the outlet side of the regulator rather than the reactor pressure; a cell placed before the regulator has to be rated for the 100–250 psi held in the reactor.
10 min residence at 80, 100, 120, 150 °C; then 20 min at 100 and 120 °C; 30 min at 100 °C [3]
15 min residence at 25, 50, 100, 150 °C at 1:1, repeated at 100 and 150 °C at 1:1.2 [3]
Give the flow rate, pressure and temperature at the flow cell, the solvent and its IR or Raman window, the measurement interval needed, and whether the cell sits before or after the back-pressure regulator.
04
What to send for a PAT sampling and flow-cell module
Paste it into your enquiry below or into an email to a maker, then replace every bracket.
Process: [fluid; phase; pressure; temperature; line size]
Measurements: [attributes; analyzers; in-line, on-line or at-line]
Delay: [maximum allowed from tap to result]
Conditioning: [cooling; pressure reduction; filtration]
Flow cells: [number; path length or window; pressure rating; wetted materials]
Return: [to process or drain]
Controls: [signals; data link to the control system]
Explore company information and manufacturing capabilities, then discuss the scope of your project with a relevant supplier.
Share this page
Compiled and source-reviewed by the CNFX editorial team.
Each manufacturer above links to the page on that company's own website where the product is listed, with the date we checked it. How we source and review
· Page last updated 13 October 2026
Buyer questions
What response time should a process analyzer sample system meet?
Swagelok's paper names one minute as the industry standard; the analyzer's own cycle time adds to the transport delay. [1]
Why is a gas sample slower than a liquid in the same line?
Swagelok's example multiplies velocity by flowmeter pressure over line pressure; at 300 psia against 15 psia the gas moves 20 times slower, so 100 ft takes 10 minutes instead of 30 s. [1]
What is the difference between in-line, on-line and at-line?
FDA's 2004 PAT guidance: in-line leaves the sample in the stream, on-line diverts it and may return it, at-line removes and analyzes it close to the stream. [2]
Sources and what still needs a direct check
Sources checked 2026-10-13. Three sources: Swagelok's paper by Nordstrom and Waters on time delay in analytical instrumentation systems (2017), FDA's 2004 PAT guidance for industry, and the Mettler Toledo and Vapourtec white paper on FlowIR integration with flow reactors.